IC Markets Home Assinar em Web Trader Contacte-nos
IC Markets Social IC Markets Social

Centro de Informação para
Traders Sérios

  • Sobre nós
  • ABRA UMA CONTA DE NEGOCIAÇÃO
  • TESTE UM DEMO GRATUITO
  • Comece a Operar
  • Visite nosso blog
IC Markets Social
  • Sobre nós
  • ABRA UMA CONTA DE NEGOCIAÇÃO
  • TESTE UM DEMO GRATUITO
  • Comece a Operar
  • Visite nosso blog
November 24, 2022Australian_Stocks_enIC Markets

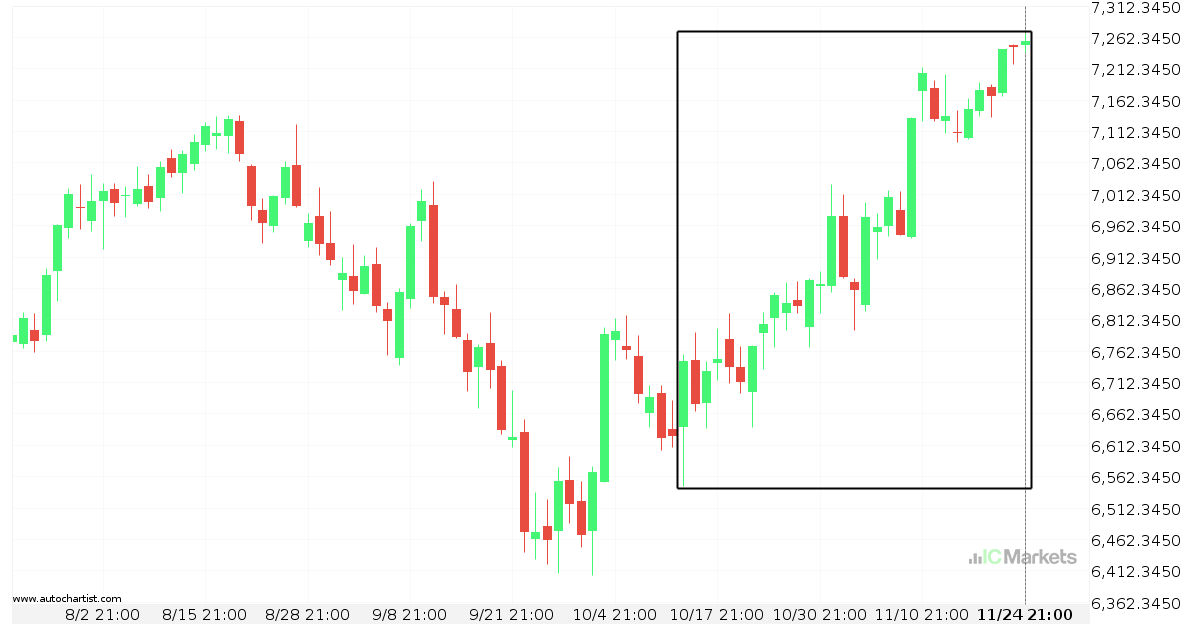
Huge bullish move on Australia 200 Index

Australia 200 Index has moved higher by 7.55% from 6746.72 to 7256.11 in the last 44 days.

Read more
November 24, 2022Australian_Stocks_enIC Markets

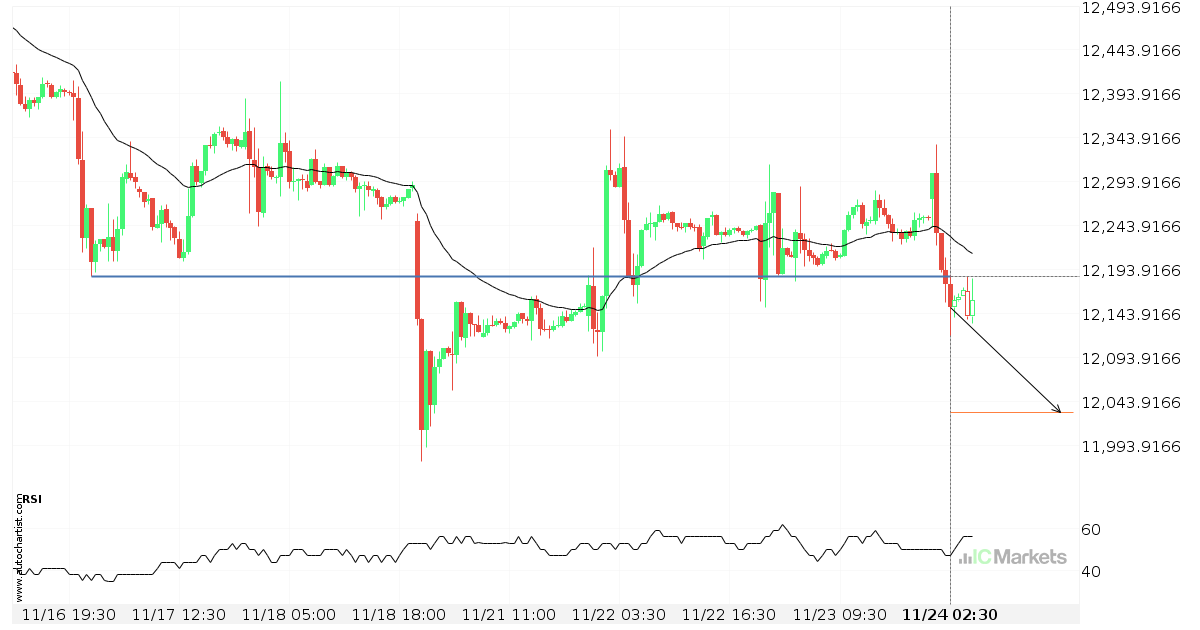
Important price line breached by FTSE China A50 Index

FTSE China A50 Index has broken through 12185.9902 which it has tested numerous times in the past. We have seen it retrace from this price in the past. If this new trend persists, FTSE China A50 Index may be heading towards 12031.7412 within the next 21 hours.

Read more
November 23, 2022Australian_Stocks_enIC Markets

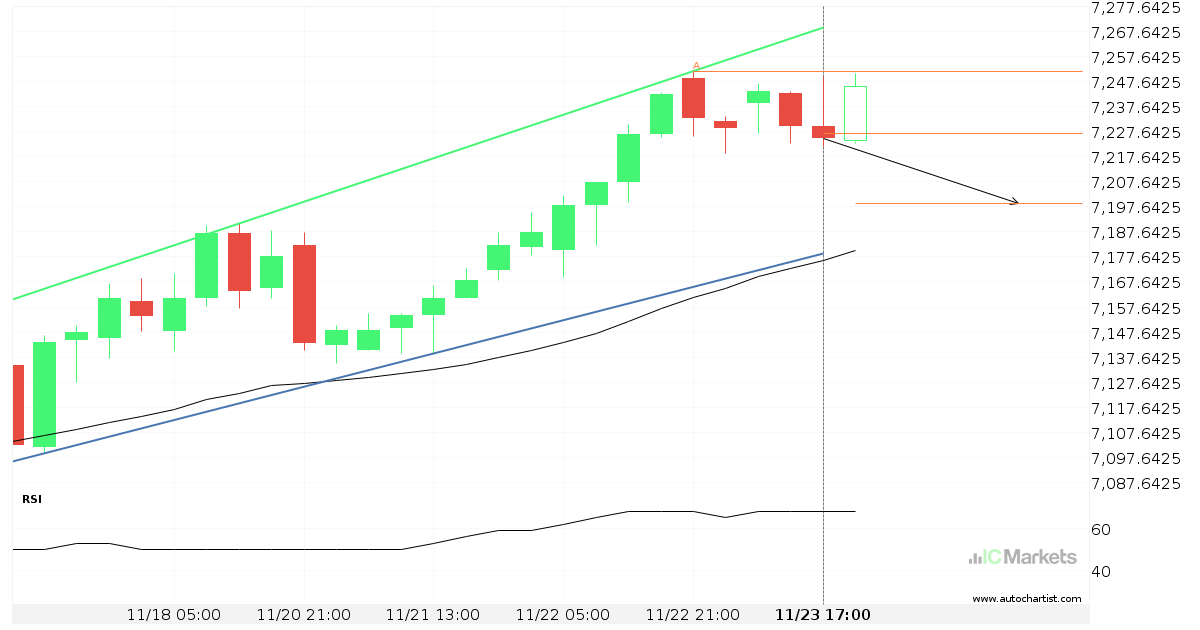
Australia 200 Index approaching support of a Flag

Australia 200 Index is approaching the support line of a Flag. It has touched this line numerous times in the last 9 days. If it tests this line again, it should do so in the next 2 days.

Read more
November 22, 2022Australian_Stocks_enIC Markets

Australia 200 Index – resistance line breached

Australia 200 Index has broken through the resistance line of a Triangle technical chart pattern. Because we have seen it retrace from this line in the past, one should wait for confirmation of the breakout before taking any action. It has touched this line twice in the last 8 days and suggests a possible target […]

Read more
November 21, 2022Australian_Stocks_enIC Markets

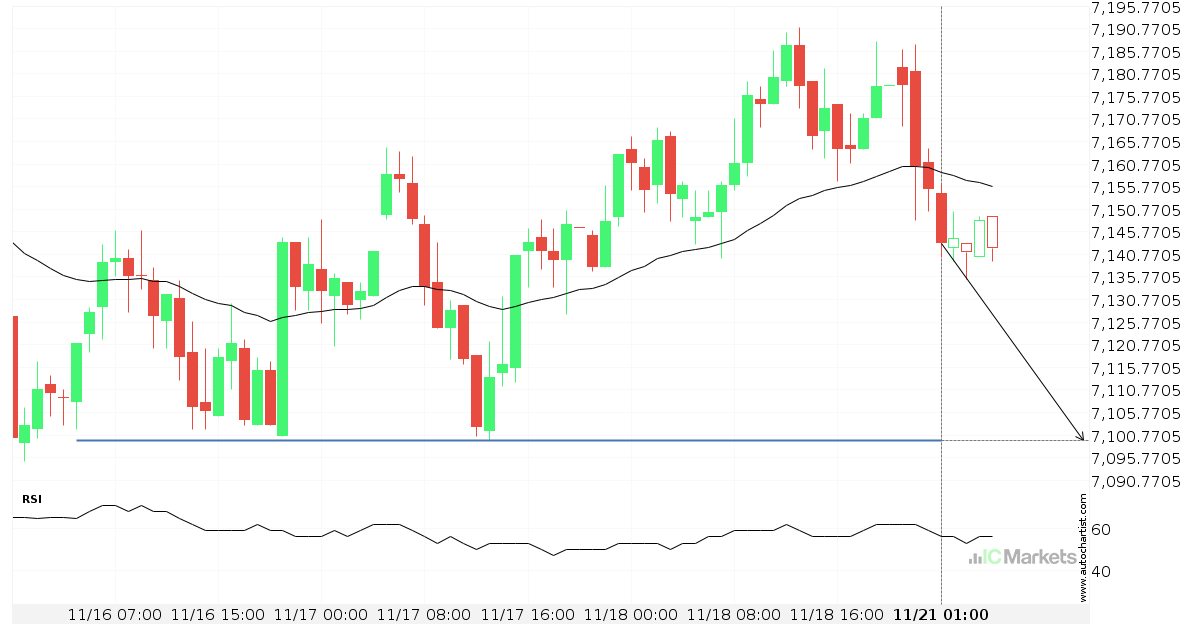
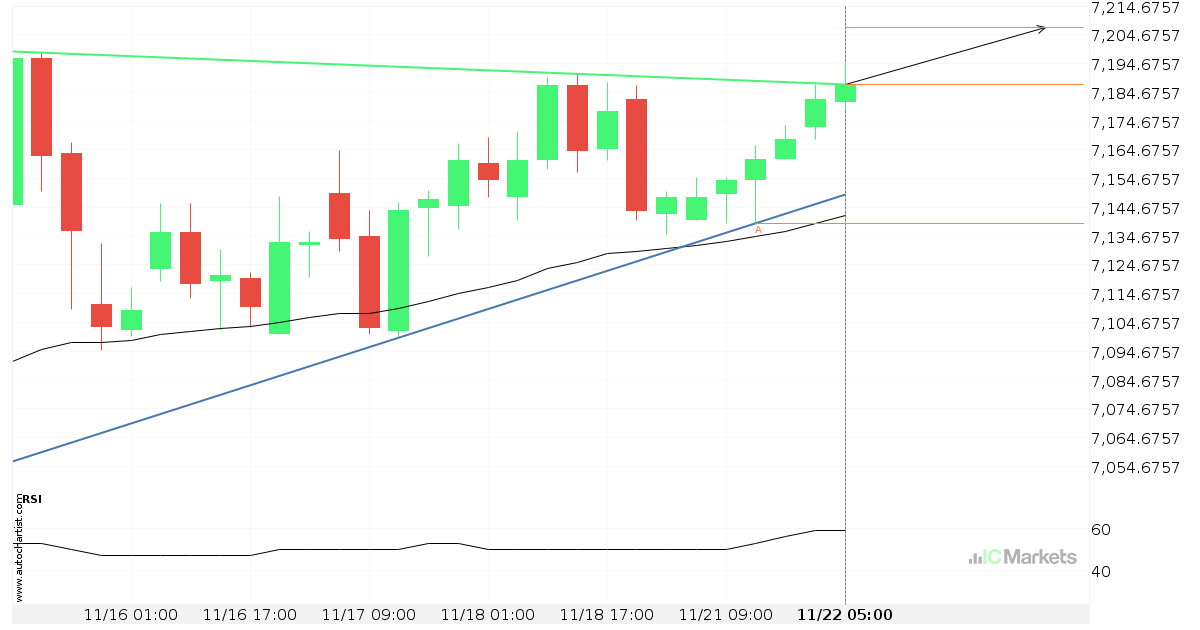
A final push possible on Australia 200 Index

Australia 200 Index is heading towards 7099.4600 and could reach this point within the next 12 hours. It has tested this line numerous times in the past, and this time could be no different, ending in a rebound instead of a breakout. If the breakout doesn’t happen, we could see a retracement back down to […]

Read more
November 20, 2022Australian_Stocks_enIC Markets

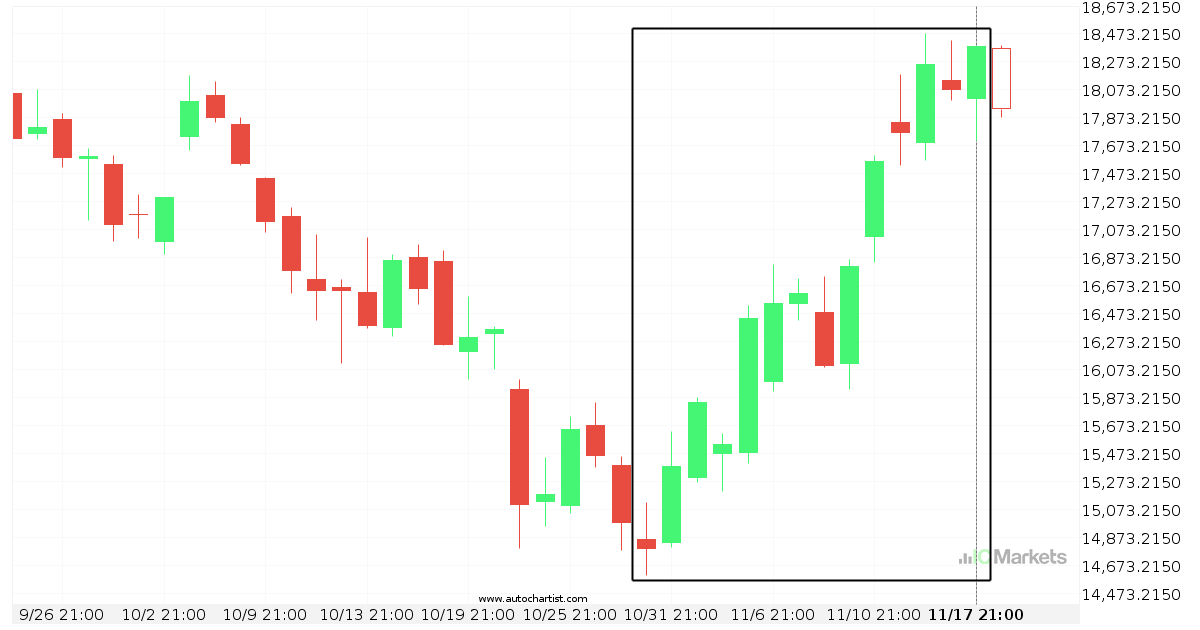
Hong Kong 50 Index is on its way up

Hong Kong 50 Index has experienced an exceptionally large movement higher by 24.33% from 14784.8 to 18382.0 in the last 19 days.

Read more
November 17, 2022Australian_Stocks_enIC Markets

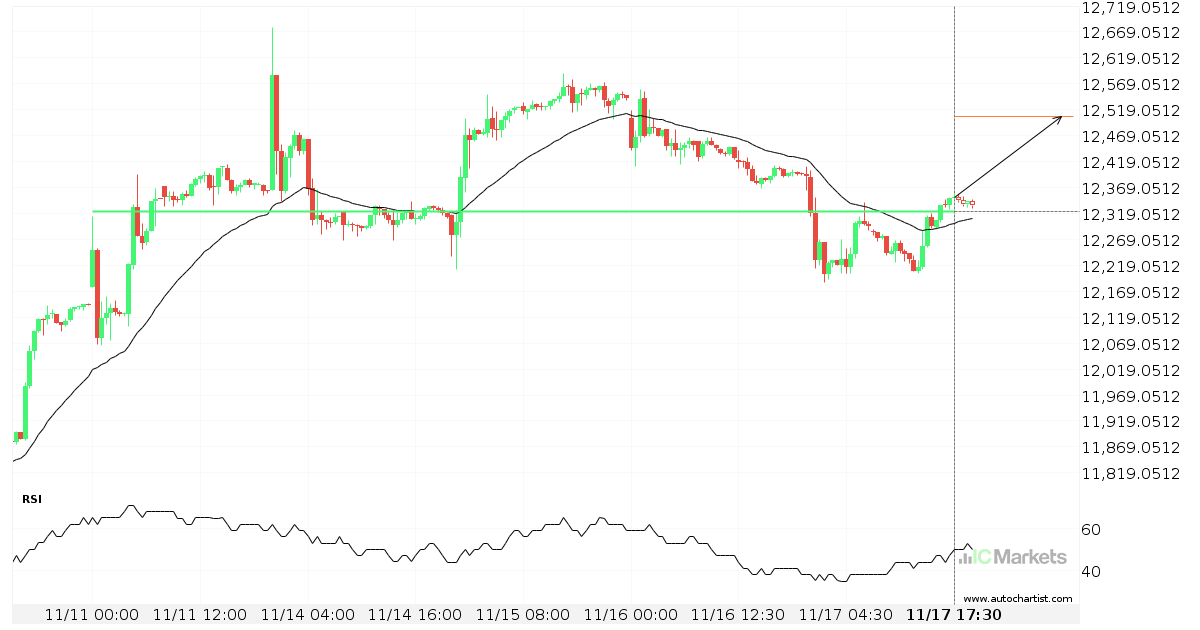
Possible start of a bullish trend on FTSE China A50 Index

FTSE China A50 Index has broken through a line of 12322.0498. If this breakout holds true, we could see the price of FTSE China A50 Index heading towards 12506.7520 within the next 22 hours. But don’t be so quick to trade, it has tested this line numerous times in the past, so you should probably […]

Read more
November 16, 2022Australian_Stocks_enIC Markets

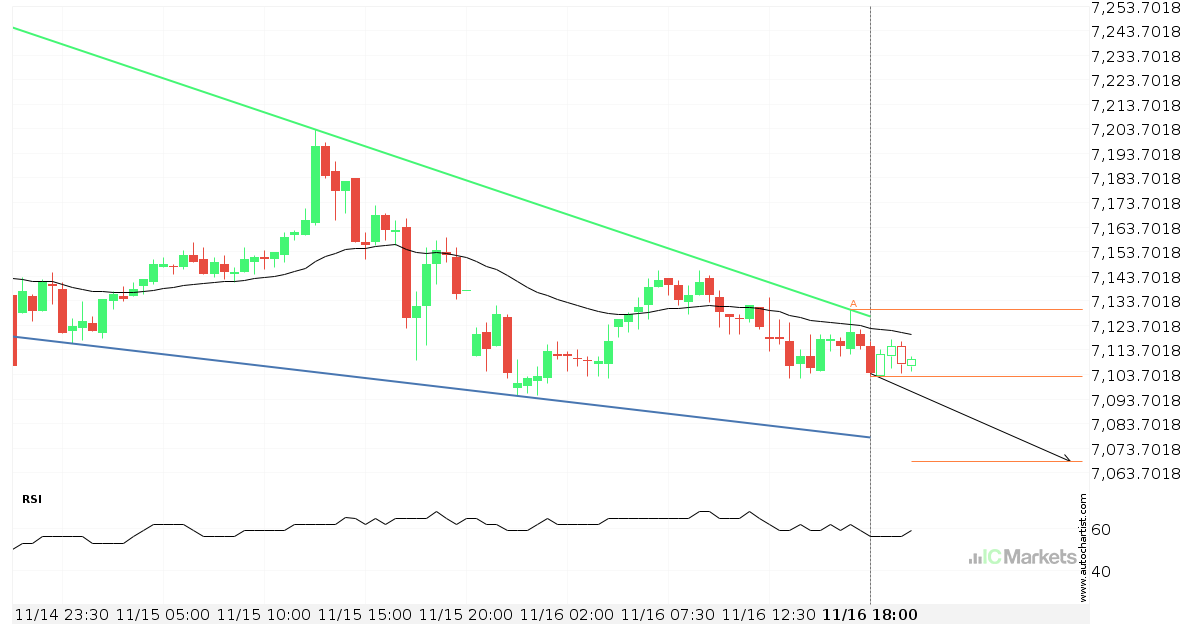
Australia 200 Index approaching support of a Falling Wedge

Australia 200 Index is approaching the support line of a Falling Wedge. It has touched this line numerous times in the last 3 days. If it tests this line again, it should do so in the next 11 hours.

Read more
November 16, 2022Australian_Stocks_enIC Markets

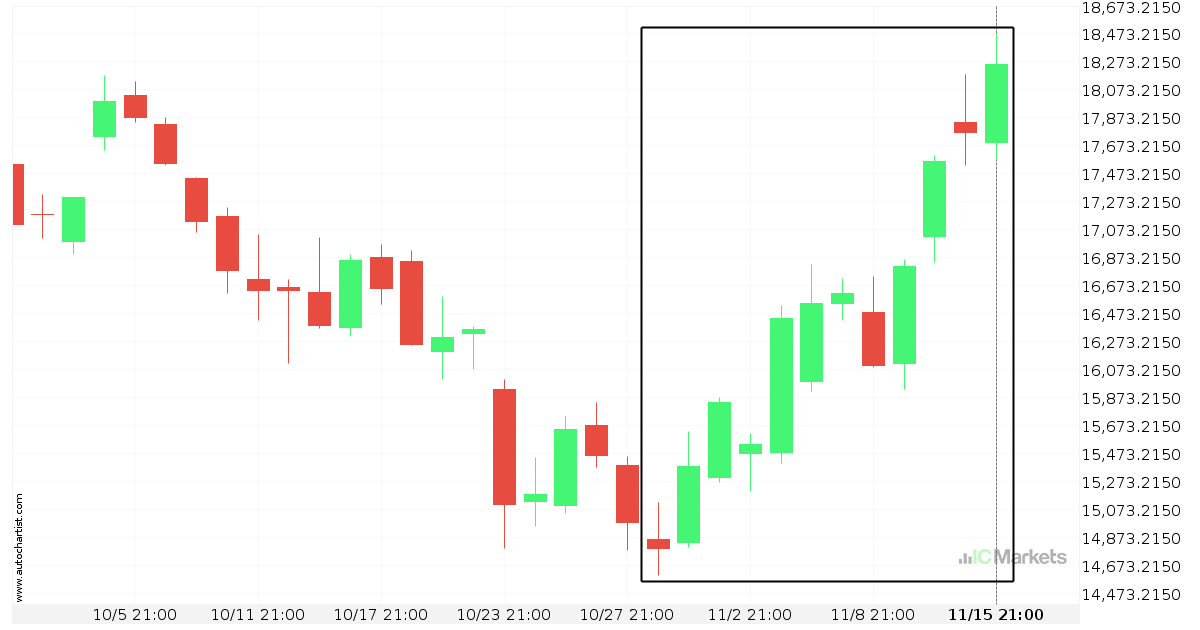
Huge bullish move on Hong Kong 50 Index

Hong Kong 50 Index has moved higher by 23.48% from 14784.8 to 18256.1 in the last 17 days.

Read more
November 15, 2022Australian_Stocks_enIC Markets

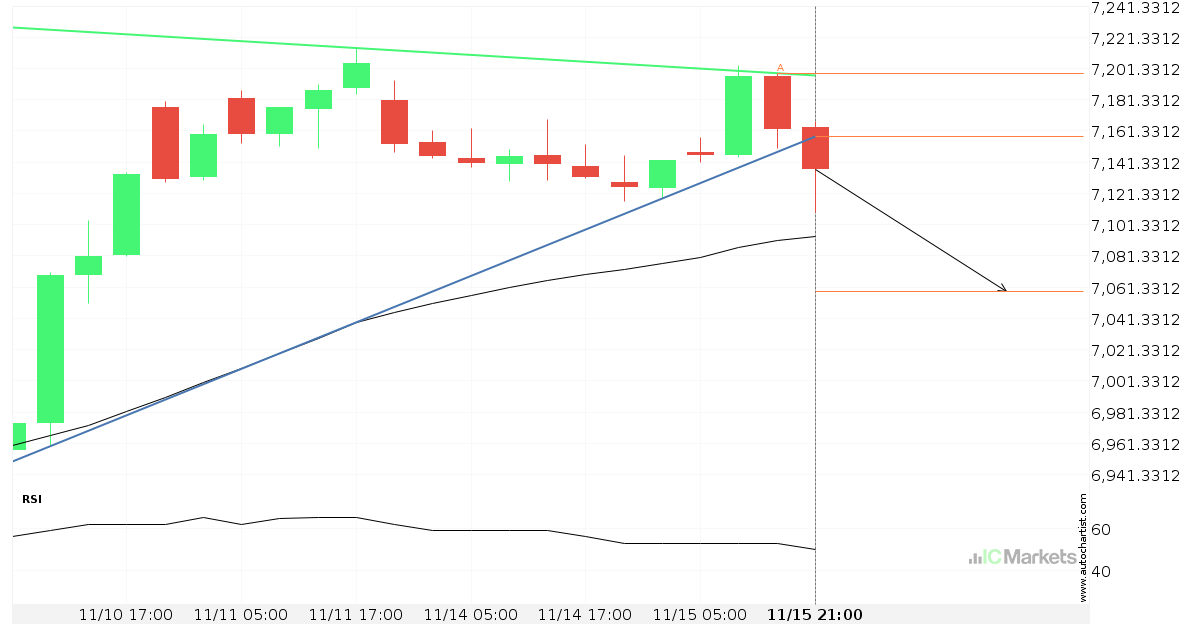
Australia 200 Index has broken through support

Australia 200 Index has broken through a support line. It has touched this line at least twice in the last 12 days. This breakout may indicate a potential move to 7058.4211 within the next 2 days. Because we have seen it retrace from this position in the past, one should wait for confirmation of the […]

Read more
  • 1
  • 2
  • 3
  • …
  • 55
  • 56
  • 57
  • 58
  • 59
  • 60
  • 61
  • …
  • 153
  • 154
  • 155

Recent Posts

  • UK 100 Index – المستوى الرئيسي – مقاومة
  • Gold vs US Dollar – نموذج الرسم البياني – قناة صاعدة
  • US Wall Street 30 Index – المستوى الرئيسي – مقاومة
  • Brent Oil vs US Dollar – نموذج الرسم البياني – قناة صاعدة
  • Brent Oil vs US Dollar – نموذج الرسم البياني – قناة صاعدة

Recent Comments

    Translation


     Edit Translation

    Negocie com um

    líder de mercado no qual possa confiar

    ABRA UMA CONTA DE NEGOCIAÇÃO TESTE UM DEMO GRATUITO

    Trading com Forex

    • Visão Geral de Contas
    • Abrir uma Conta
    • Lançar Web Trader

    Especificações de Trading

    • Spreads e Comissões
    • Gama de Mercados
    • Horas de Trading
    • Financiamento
    • Levantamento

    Acerca da IC Markets?

    • Help Center
    • Porquê a IC Markets
    • Regulamentação
    • Documentos Legais
    • Contacte-nos


    Forex Trading

    • Accounts Overview
    • Open an Account
    • Launch Web Trader

    Trading Specifications

    • Spreads and Commissions
    • Range of Market
    • Trading Hours
    • Funding
    • Withdrawal

    About IC Markets

    • Chat with a Specialist 24/7
    • Why IC Markets
    • Regulation
    • Legal Documents
    • Contacte-nos

    Isenção de Responsabilidade: Este material corresponde a material de marketing em que todo o material de marketing é publicado apenas para fins informativos. Este material não contém e não deverá ser considerado como contendo - aconselhamento de investimento e recomendações ou sugestões para adotar quaisquer ações relativamente a instrumentos financeiros. Os widgets incorporados pertencem aos seus autores externos independentes e a IC Markets não é responsável pelo seu conteúdo ou pelo seu impacto na negociação.

    Todos os direitos de conteúdo reservados. As opiniões dos autores poderão não coincidir com a opinião dos editores do blog. Aquando da cópia de materiais a partir deste site ou aquando da ligação ao RSS feed, para republicar os nossos artigos, é necessário um link para a IC Markets ou a atribuição no formato 'IC Markets Blog'. Para questões gerais, por favor, entre em contato com a agência editorial através do formulário da nossa página de Contato.

    Alerta de Risco: A negociação de Derivados acarreta um elevado nível de risco para o seu capital e deverá negociar apenas com dinheiro cuja perda possa suportar. A Negociação de Derivados poderá não ser adequada para todos os investidores e, como tal, por favor, certifique-se de que entende plenamente os riscos envolvidos e procure aconselhamento independente, se necessário. Deverá ser considerada uma Declaração de Divulgação de Produto (PDS) antes de efetuar uma transação connosco.

    O conteúdo desta página corresponde apenas a informação geral e não tem em conta a sua situação pessoal, objetivos ou necessidades financeiras. Cabe-lhe a si certificar-se de que os produtos que nós oferecemos se adequam às suas necessidades específicas. Não deverá negociar connosco, a menos que entenda as caraterísticas e os riscos dos produtos que nós oferecemos. Isto significa que poderá precisar de procurar aconselhamento independente antes de começar a negociar connosco.

    © 2022 Raw Trading Ltd | All rights reserved.
    • Sample Page